
A Financial Analyst's Dream Data
Financial Master Data Part 4


This is the fourth part of my series on Financial Master Data (FMD). Find the first three installments here:
Part 1: What Is Financial Master Data?
Part 2: The Core Elements of Financial Master Data
Part 3: Profit Centers: The Key to Painless Product P&Ls
If you asked all the financial analysts of the world to tell you what they really want their data team to give them, I’d bet most would ask for all their data in a single pivot table.
A pivot table is just like a Rubik’s Cube, except it’s built with data instead of plastic squares. Spreadsheet tools like Microsoft Excel and Google Sheets include this built-in feature. It’s like magic:
It summarizes numbers at any level and any intersection of data that you want.
It’s three-dimensional, not flat like a report, allowing you to view the data from multiple angles.
The speed makes it most fun - you can add up massive datasets as fast as you can click.
It’s completely interactive - you ask questions, and it finds the answers.
It begs you to twist and turn the data.
Here’s a conceptual drawing showing data in cube form:
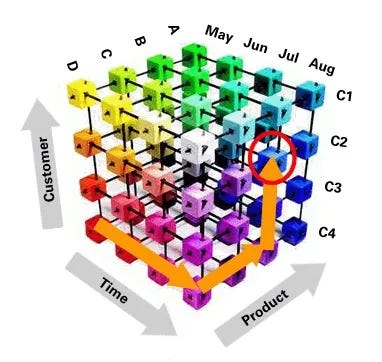
The Rubik’s Cube puzzle starts with the colors all mixed up, and you solve it by twisting and turning the pieces until the colors on every side match. Pivot tables do the same thing with data. Financial analysts are right: all your business data should be pivotable, like a Rubik’s Cube.
One Pivot Leads To Another
Financial master data connects all the pieces of your data puzzle. As I explained last month, it’s the underlying data structure that all sources of business activity share.
A company with its business data fully connected by financial master data can see all its activity from three perspectives, or “views.”
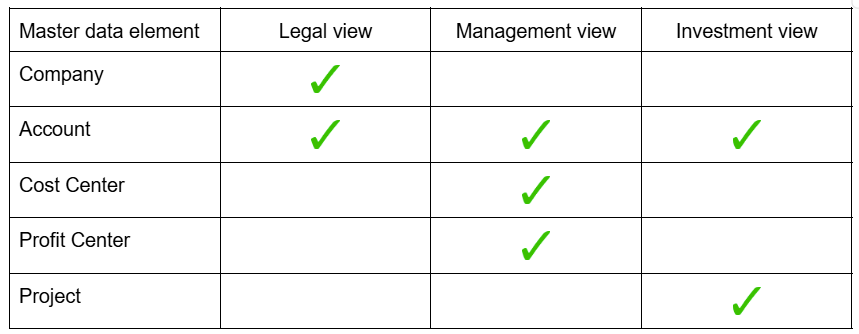
Legal view: Accountants use this view for financial reporting to investors and tax authorities. They refer to these fields as the “chart of accounts.”
Management view: Financial analysts use this view to analyze the company’s performance for different business segments.
Investment view: Business managers use this view to make forward-looking product and service decisions.
Let’s say your company shipped $1 million worth of product in a quarter. The legal view shows the portion of that revenue subject to California taxes, helping you to compare it with other states or countries. The management view shows how much revenue came from automotive products (for example). Finally, the investment view helps you see how your new products grew (or didn’t) in each locality and business unit.
That’s the essence of data analysis - looking at the same data from as many different points of view as possible. One question leads to another, and pivotable data makes it work.
Why Dashboards Died
Without this financial master data solution, all future self-service analytics platforms will fail to meet the expectations of financial analysts. Why? Because the data that people feed into those platforms is not pivotable, and their analytics platform can’t do much to change that. Nothing makes an analyst happier than being able to twist and turn their data, looking at it from every possible angle, as a pivot table allows them to do.
Case in point: dashboards are dead. Tableau Software, the dashboard company that Salesforce acquired for over $15 billion in 2019, now avoids using the word “dashboard” to describe its new flagship product, “Next.” Ben Rogojan (@seattledataguy), one of LinkedIn’s most popular data influencers, agrees. He says that Excel is “the only truly universal self-service analytics tool.” Every analyst just wants their data in a pivot table.
Would you like to fit all your business data into a massive pivot table? It begins with the center core: financial master data.
To remind you of this week’s data concept, enjoy Shake It Up by The Cars, from the Frictionless Data Spotify playlist.
Nice!
Currently rebuilding our FP&A tool (a Workday related one...). It works like a large Pivot table (once i get the rollups going well).
Do you formally set up the profit centers hierarchy? Do you sit down and formalise the product lines, product family, Business Unit? and then make sure all departments follow this? You say here is the structure...
Also, what are your thoughts on cost allocation methods? Allocating non-direct fixed overheads to product lines? And where this calculation should sit (Planning too; or the datalake)