This is part 2 of my series on Financial Master Data. You can find part 1 here.
After many failed attempts to solve my Rubik’s Cube puzzle, I finally tried taking the whole thing apart. That didn't help. YouTube didn’t exist when I first got my hands on one of these little plastic 3x3 puzzles, but I learned recently (from a video) that you can easily reassemble it if you know the secret connection.
Start with the cube's center core and assemble it in this order: center pieces, edge pieces, then corner pieces.
A Hungarian architecture professor named Enro Rubik invented the cube in 1974. He wasn’t trying to design a toy; he was trying to build a structure where all the parts could move independently without falling apart. The cube's center core looks like a 3D cross—a scaffold of three intersecting axes reaching out in six directions. It holds the six center squares in place but allows them to rotate. Then, the 20 smaller plastic pieces (cubies) attach to it to form the assembled puzzle.
Maybe you’ve struggled to organize your company’s data. It feels like a broken Rubik’s Cube scattered on the table.
I’ve got good news: a hidden framework beneath your business data can connect it all. Financial master data links all your business activities like a Rubik’s Cube center core.
The Unseen Framework
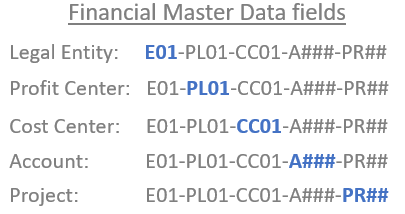
Financial master data is the unseen framework beneath all your business data. It includes five core data elements:
Entity. This is your organization’s legal name and ID that corresponds with a tax authority. Most large companies contain dozens of legal entities. They set-up complex transaction flows between these entities to help them maximize their tax advantages.
Account. This financial master data categorizes every business transaction as income, expense, asset, or liability. Companies break down those categories into much more detail, like services (a subset of revenue), salaries (expense), buildings (asset), and accounts payable (liability). Accounts are the foundation for journal entry accounting and modern analytics, which I wrote about earlier.
Cost Center. Cost centers identify the person responsible for managing different parts of a company’s expenses. They are also known as “departments.” Cost centers usually link directly to a profit center, but some collect general expenses (like legal costs) that finance teams allocate to profit centers.
Profit center. Profit centers track financial performance for subsets of your company. Companies use various other names for this data, like business unit, line of business, product line, segment, branch, or division. It combines revenue with all the expenses (cost centers) directly related to the business unit or allocated to it. It’s the lowest level of detail at which financial systems track net income.
Project. This field tracks income and expenses directly related to a specific company initiative. Companies use different names for projects depending on their industry; a semiconductor company calls this “core die,” while a university might refer to it as a “course.” Projects often relate to new business opportunities that require upfront investment, so it’s helpful to use this master data to collect costs and compare them to the future revenue for the project.
The Center Data Core
The Rubik’s Cube core perfectly illustrates how financial master data connects all your business data.
Like the center core, you can't see financial master data in your business activity data. It’s hidden beneath the surface. Financial master data exists only to connect the parts.
Some parts of your business are closer to the core than others, like the center, edge, and corner pieces of the cube.
The touchpoints change. Not all of your business data is directly connected to other parts, but it all connects to financial master data. You can only see the connection between research and development data and sales data, for example, from certain angles.
Like newer versions of the Rubik’s Cube, good financial master data management makes it easy to change the shape of your analytic data. It gives you built-in flexibility.
Without connecting all your data to this financial master data core, everything falls apart. That’s a simple explanation for almost every business analytics problem I’ve seen.
Get Connected, Get Well
Truthfully, this connection isn’t a secret at all. In fact, it’s the ancient idea behind all business analytics. Still, for most of us trying to help our companies make better, faster decisions, this might sound like an entirely new way of thinking about data. Maybe that’s how it sounds to you.
I hope so. I’ve seen this insight help even some of the most seasoned finance executives understand why their business data isn’t flowing with their product decisions. A senior analyst recently shared with me how this is helping her resolve issues in her company’s expense allocation process. It’s a way to think about your data systematically, and it can help you stop creating point solutions that answer a question but don’t improve the overall usefulness of your data.
How do you unleash the power of your business data? You’ll find the secret in the underlying connection, just like the center core of a Rubik’s Cube.
To help remind you of these concepts, I’m now adding a hit 80s song to the Frictionless Data Spotify playlist each week. This week, enjoy She Blinded Me With Science by Thomas Dolby.


