
Simplify Many-to-Many Relationships
Scaling Decisions with Data Models


Frictionless Decisions brings you counterintuitive, original, jargon-free ideas for connecting data to decisions. Every week.
In this guest post, Diana Nekhorosheva applies a core Frictionless Decisions concept: a good data model scales up decisions for a company when it’s understood by everyone. Simplyfying master data relationships is a great example of this. Thanks, Diana!
In Silicon Valley, we love to talk about scale: hyperscale, web scale, AI scale. “Scale” describes your company’s ability to grow - to increase revenue, customer base, design pipelines, or product complexity, without major disruptions. People often think of scale in sales goals - simple, round numbers, like $1 billion. Yet in the race for scale, they forget what holds them back: a lack of simplicity.
A good business intelligence (BI) strategy doesn’t simply deliver dashboards, reports, or algorithms; instead, it delivers scale for decisions. It reduces the complexity of many-to-many data relationships into something a human, like your analysts, managers, and executive teams can actually understand. By reducing complexity for everyone, you immediately improve the decision-making process. BI solutions work when the data relationships are clear.
Many-to-Many Everything
Anyone who has touched semiconductor business data knows how quickly complexity spirals. A partner network includes hundreds of entities, each operating across multiple territories. Those territories sell tens of thousands of products. Multiple partners buy multiple products and ship them to dozens of end customers. It’s a perfect storm of many-to-many relationships, all tangled together.
Here’s a simple example using sales distribution data:
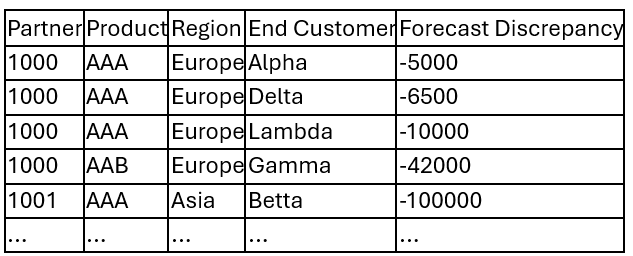
Try to locate the exact end customer responsible for the discrepancy for each product. It’s like searching for a needle in a haystack. This many-to-many ambiguity makes it really difficult to take any action. Someone must save the day and solve these many-to-many relationships!
From Chaos to Clarity
You can do that by forcing clarity with a good data model.
When you face many-to-many relationships, you can simplify them into one-to-one or one-to-many structures. The most effective way to do this is to define a combined key, the anchor that ties your story together. Start by asking what data dimension you’d like to analyze. If the goal is to find the end customer contributing most to a forecast discrepancy, then the key becomes the combination of partner and product.
Once you define that key - say, 1000 AAA - you can sort your data around it. And instead of showing every end customer, you show the dominant one: the customer responsible for the largest share of the discrepancy.
Suddenly, the noise collapses into something readable:
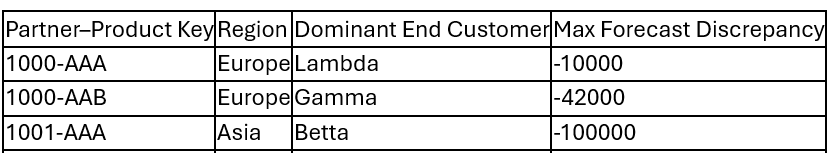
Now your audience sees one partner–product, one region, one end customer - one clear signal. The cognitive load drops dramatically. The insights start to emerge.
If you want to go further with the simplification, use the “rule of three.” People remember ideas presented in groups of three better than in longer lists. It’s a great rule to follow because people always try to sneak complexity back into your systems, through KPIs, dashboards, and “just one more metric” requests. It grows like weeds. Every team wants its own dashboard, every VP wants their own slice of the truth.
A Lesson From Outer Space
Maybe you’ve heard the term “golden record” as a strategy for simplifying data quality, but you might not know that the term comes from an actual disc made of gold. When NASA launched the Voyager mission in 1977, it carried the “Golden Record,” a time capsule of Earth’s sounds and images. The instructions for decoding it weren’t written in English, Mandarin, or binary. They were written in physics, the one language any civilization could understand. NASA assumed that if someone found Voyager, they would need instructions that outlived culture, technology, and time.
Your data structures deserve the same treatment; they should be understandable to anyone.
If an alien civilization or your new hire found your data model, they should be able to decode it.
Simple clarity - not chaotic complexity - delivers the scale everyone longs for.
Diana Nekhorosheva holds a Master of Arts in International Business Administration and Foreign Trade (University of Applied Sciences, Germany) and is currently studying leadership, strategy, and innovation at the Stanford University Graduate School of Business. She brings deep experience in semiconductor supply chain analytics to her written work.

To help remind you of these concepts, I’m now adding a hit 80s song to the Frictionless Data Spotify playlist each week. This week, enjoy New Europeans by Ultravox.
For the full story about making data flow faster and better, check out Frictionless Data on Amazon.

 | A guest post by
|